Introduction

Good air quality is essential for our well being and a prioritized environmental goal in Sweden, as well as the European Union and the United Nations. Problems with air pollution in cities are extensive world-wide and Swedish cities are no exception.

Access to much environmental data is important to be able to take adequate measures. Data from micro sensor platforms has been shown to be a good complement to the limited number of expensive reference stations that are currently used for measuring air quality in many cities.

A mobile sensor platform that is mounted on commercial vehicles (e.g., taxis, buses, refuse vehicles) can provide data with good geographic coverage, already with a limited number of units.

The Project

The Växjö iFleet Pilot is a pilot project with support from the Swedish Environmental Protection Agency program Innovations for sustainable cities: Grants for leading-edge technologies and new system solutions. The project focuses on the mobile sensor system iFleetsense that has been developed by the two Swedish companies Pointguard and Upwis.

The goals of the Växjö iFleet pilot project is to investigate in what ways mobile sensor systems can be useful to city managers and to highlight examples of this to the public and other managers. This will hopefully lower the threshold for those interested in using and investing in this type of technology.

Implementation

The project officially started in July 2018 and during the autumn of 2018 planning and analysis was performed to be able to adapt the iFleetsense to the Växjö pilot. An adapted version of the system was then created and produced.

During spring 2019 a number of iFleetsense systems were rolled out in Växjö, mounted on taxis from Växjö Taxi company. These vehicles are used normally, while simultaneously gathering data for the project. The data are sent in real time to the iFleetsense cloud.

The City of Växjö

Växjö is a city situated in Southern part of Sweden. With around 70 000 inhabitants in the actual city and slightly less than 100 000 inhabitants in the whole municipality it is the 19th largest city in Sweden. The city is characterized by the surrounding lakes and the city has focused a lot on making a greener city. In 2017 the European Commission awarded Växjö the Green Leaf Award, which recognises a city's commitment to better environmental outcomes and to generate green growth.

Read more about Växjö and Växjö Municipality at their web site

Results

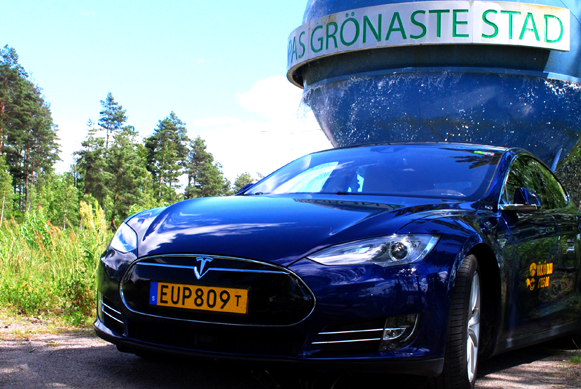
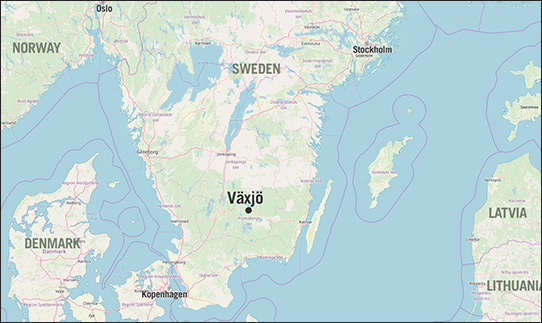
By June 2019 a full sensor network was established in Växjö by mounting sensor platforms on a number of taxis.
Below are some first results, based on more than 320 000 data, gathered between the end of February and the end of May.

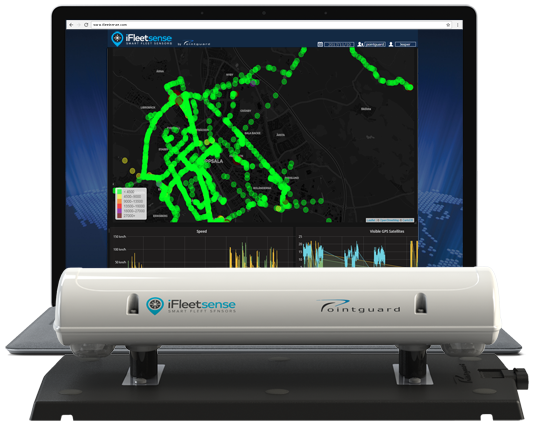
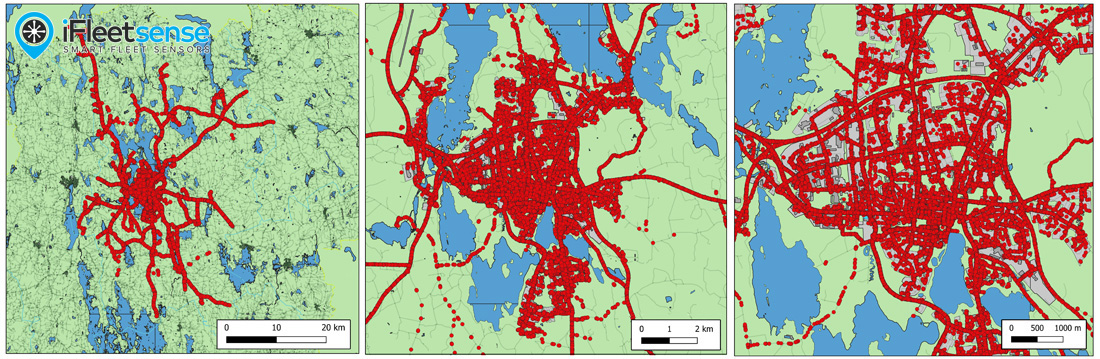
What distribution can you get by using taxis?

Taxis move a lot, but do they mainly move between certain popular locations like train station and city center or can you get an even geographic distribution of measurements with only taxis as carriers? The results from the project show that by using taxis as carriers, very good geographic coverage was obtained, see images below (more zoomed-out to the left and zoomed in to the right).

Geographic distribution of the iFleetsense Växjö Pilot


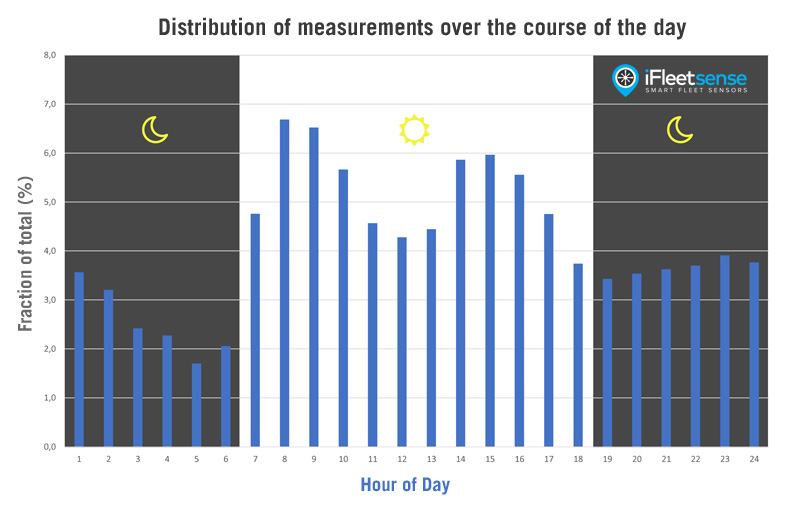
A network that never sleeps

Considering power conservation and integrity reasons data are only collected when the taxis are in service. Would this mean that there are times of day where there are no data available from the system? The project has shown that the amount of data collected during daytime, especially during rush-hours, is more than what's collected during parts of the night. But even during the early hours there are substantial amounts of data due to the fact that many taxis operate 24/7. This is visualized in the graph below.

iFleetsense never sleeps

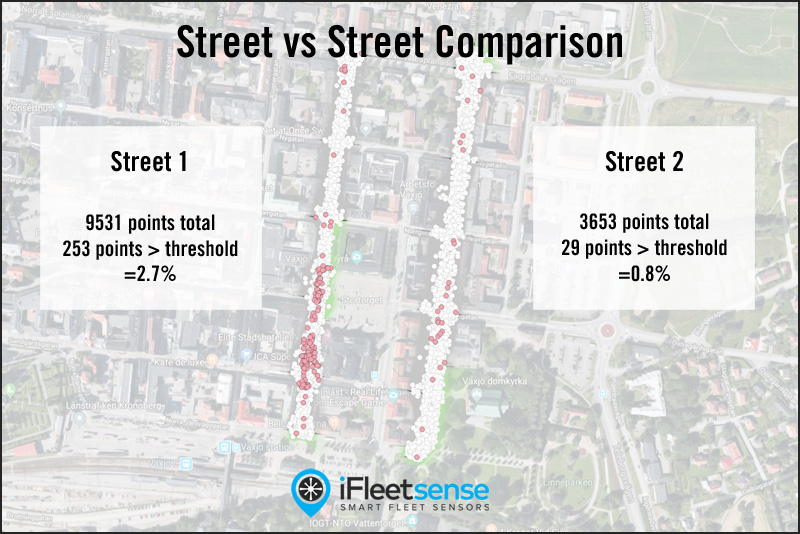
Usercase 1: Street vs Street Comparisons

One possible usercase for the iFleetsense system is that it's geographically well-distributed data allows for relevant comparisons between areas of interest, e.g. two streets. The user can set a desired threshold for a parameter and compare the number of occurences and the proportion of occurances. Reasons for such comparisons could be to find pollutors, better understand why air conditions are better in some locations than others, or planning for re-routing traffic.
The image below shows such a comparison with real data from the pilot.

iFleetsense for Street vs Street comparisons

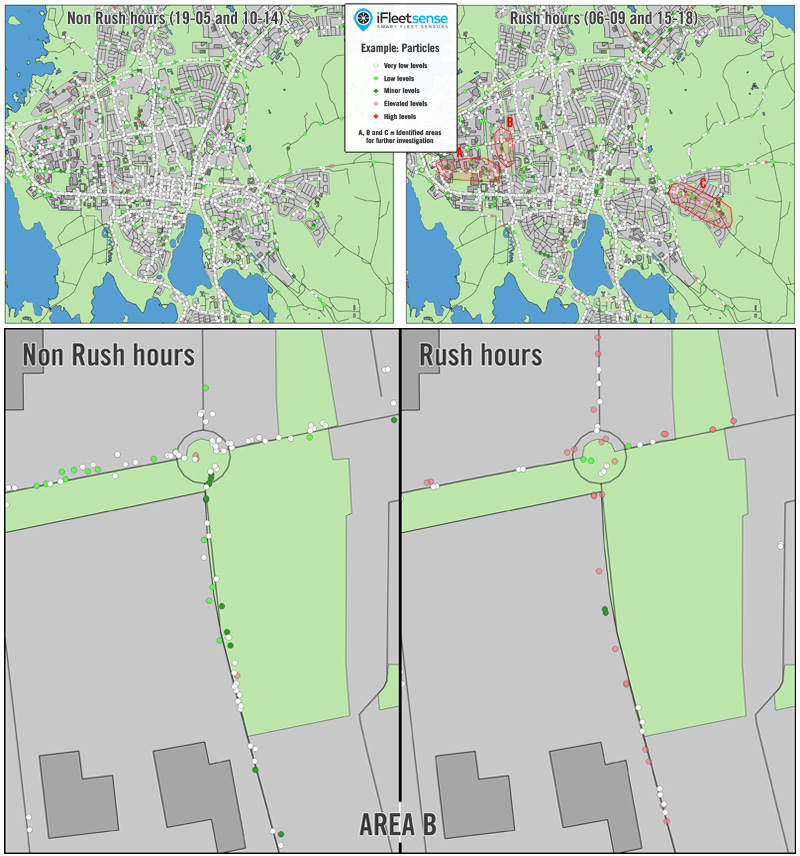
Usercase 2: Comparison of different periods of time - Rush hours impact example

Having plenty of distributed data accross all hours enables geographic analysis between different time-frames, e.g. are there differences between rush hours and non-rush hours and in which locations do these differences occur?
The map below uses particle values during rush hours (06-09 and 15-18) vs Non-rush hours (10-14 and 19-05) from one week as an example. Generally the air quality is very good, but some areas with slightly elevated values during rush hours can be identified (A, B and C), which can then be analyzed further. The maps below show a close-up of area B.

iFleetsense - Compare Rush hours vs Non-Rush hours